Author Archives: Phoenix Investor Relations
SWF Update
Sovereign wealth funds are developing more in-house portfolio management teams after the global crisis according to Cerulli Associates. We confirm that this is a trend we have been seeing for some time. While most of the $3 trillion estimated to be managed by SWFs assets continues to be outsourced or passively managed in index replication funds and ETFs, many of the biggest funds have set up in-house Alpha teams with very aggressive return objectives such as doubling their money in three years. This resembles a bar-bell investment approach on a large scale, marrying very cautious outsourcing and passive investing with in-house risk taking in the form of highly concentrated portfolios. The performance of many SWFs was hit particularly hard by the crisis so it is not surprising to see a change in investment approach.
Brokers “sell” meetings with CEOs and CFOs for $4,500 p/meeting at conferences and $7,500-$10,000 p/meeting on non-deal roadshows
No wonder the sell-side is so aggressive in “selling” corporate access to issuers. The meetings are worth a lot to them, according to an annual survey by Greenwich Associates, as one-third of U.S. equity research commissions are being used to compensate the sell-side for arranging meetings with corporate management teams. One third of the market in U.S. equity research commissions, estimated to be worth $12.1 billion, equates to $4 billion for corporate access, in the U.S. alone.
50% of U.S. institutions now use commission sharing arrangements but institutional commission payments continue to fall because trading volumes have dropped and the buy-side continues to shift volume to electronic systems. Nearly 40% of U.S. equity trading is now executed electronically. This shrinking market has placed increasing pressure on sell-side profitability.
The annual Greenwich survey estimated that brokerage commissions paid by U.S. institutions on domestic equities fell 13% to an estimated $12.1 billion per annum in the first quarter of 2010. An estimated 53% of these commissions, or $6.4 billion, was for research, corporate access and sales services not related directly to trade execution. 33% ($4 billion) is spent on corporate access, including 19% ($2.3 billion) for facilitating access to corporate management on non-deal roadshows and 14% ($1.7 billion) for conferences.
According to a post on Inside Investor Relations by Brad Allen, The Wall St Transcript (TWST), which provides software for sell-side firms to manage their corporate access programs under the MeetMax CAM name, estimates that 200,000 one-on-ones take place at conferences annually. On average, a meeting at a conference is worth an estimated $4,500. Integrity Research, which researches the equity research industry, reported that TWST also put a range of between $7,500 and $10,000 per meeting on the more difficult to estimate non-deal road shows.
As corporate access has become such an important business for the sell-side, how much does it benefit the companies allocating so much of their valuable executive time? If they are being taken to meet bona fide long-term shareholders and potential shareholders it is clearly worthwhile. But if valuable executive time is being spent with the wrong investors, there is clearly a problem.
If a hedge fund is effectively paying “your” broker $10,000 to meet with you, what is their agenda and is it in your interest? Is your company or one of its peers the real subject of the meeting?
And remember, not all investors are paying the broker the same amount. So who gets priority? In most cases it’s the investor who pays the most. The reality of today’s market is that the sell-side is simply not able to treat each investor impartially. It has a clear conflict of interest between the needs of its client (the investor) and its steed (the issuer).
Issuers should be concerned that the marketing process lacks appropriate transparency and companies are potential victims. There are clear conflicts of interest among financial intermediaries and there is abuse. In our opinion the disclosure of trading conflicts is completely inadequate and companies should demand much more transparency from the sell-side.
For the Greenwich report please click on http://www.greenwich.com/Greenwich0.5/CMA/campaign_messages/campaign_docs/naeif-10-GLG.GR.pdf
Update on GCC SWFs
According to a study by the Emirates Centre for Strategic Studies the value of the GCC’s external financial portfolio fell from $1.3 trillion in 2007 to $1.2 trillion in 2008.
Total assets held by SWFs in the GCC states are estimated to be worth more than $1 trillion. If assets held by central banks – estimated to be worth $460bn – are added, the value of the combined portfolio of the Gulf’s SWFs totals $1.5 trillion.
According to the projections by the IMF, the assets of international SWFs will range from $5-$10 trillion over the next five years. International Financial Services London estimates that the funds’ assets will increase to $5 trillion by 2010 and $10 trillion in 2015.
The UAE has eight international sovereign funds – four in Abu Dhabi, three in Dubai and one in Ras Al Khaimah.
Abu Dhabi has ADIA, Mubadala, the International Petroleum Investment Company (Ipic) and the Abu Dhabi Investment Council (Adic). Dubai has Investment Corporation of Dubai (ICD), Istithmar World and DIC, while Ras Al Khaimah has RAK Investment Authority.
The GCC states have been allocating part of their SWF investments to Arab states, especially Egypt, Morocco, Jordan and Syria in sectors, such as industry, real estate and infrastructure. Asia and Africa are also seen increasingly as promising markets.
The study said GCC investment bodies that supervise the management of SWFs should work together to define a new map for combined or individual financial investment through the introduction of new priorities in their external investment programs that depend on diversification.
The study said the GCC sovereign funds should implement five measures:
– The transfer of knowledge through investments.
– Consolidation of government companies.
– The alleviation of the impact of the economic crises.
– The consolidation of regional and international co-operation through the setting up of joint funds at the regional and international levels by GCC funds.
– The implementation of reforms to boost confidence.
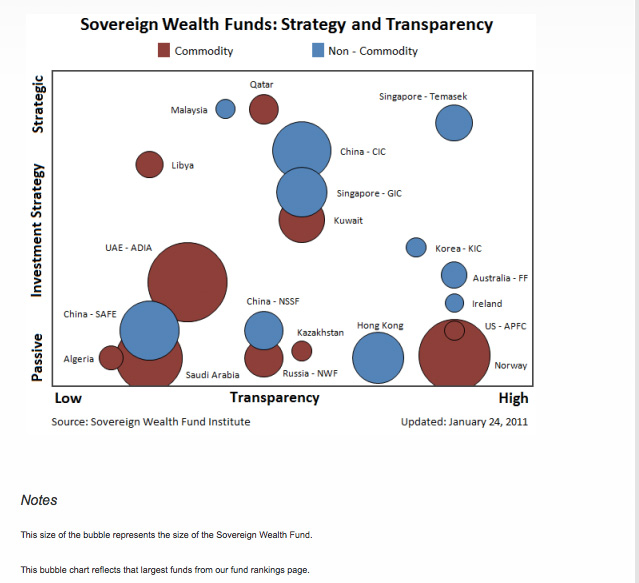
Estimated AUM for the 10 largest SWFs:
What will be the impact on IR of a move from Active to Passive?
Some say the move from Active to Passive investment strategies is inevitable because the cost/performance differential can’t be justified.
A recent survey by the IBM Institute for Business Value covering 2,750 investment industry executives, including those at endowments, foundations, and SWFs, predicts that passive investments will overtake actively managed funds. Today 70% of global assets are in active funds, which charge 1.25% on average. But over the next three years, 65% of respondents planned to move to passive strategies which charge less than 0.2%. Extrapolating the data suggests that in 20 years, 85-90% of assets will be in passive strategies, with the remaining 10-15% in hedge funds, private equity and other alternative asset classes.
But just as the recent financial crisis has exposed the flaws in efficient-market hypothesis (EMH), so a move to more indexing could provide opportunities for active managers.
Talk of London-based hedge fund exodus to Switzerland is exaggerated
In our daily interactions with the Swiss investment community we see very little evidence of the arrival of London-based fund managers fleeing the UK to Switzerland so we don’t believe there will be much impact on the targeting efforts of IROs for the time being.
As Bill McIntosh of the Hedge Fund Journal points out in a recent article, as much as 90% of the European industry’s $300 billion plus in assets is managed, directly or indirectly, from London and it is likely to stay that way. He explains that “There is a lot of talk, not too much action,” but points out that “anecdotal evidence suggests that many small-to-medium sized firms are also looking to enhance their operational flexibility. One thing that is occurring, according to a leading prime broker, is that firms are exploring setting up a management company in a more tax efficient locale. This is seeing some funds set up a second leg in Switzerland but still keep London as the main operating centre. Though London is expected to be the top European financial services hub for the foreseeable future, hedge fund principals can decamp to build a second leg but still visit the UK weekly or fortnightly, thus escaping the clutches of the Inland Revenue.”
He goes on to point out that “Another spur for setting up a Swiss office is to take advantage of the light regulatory structure. At a time when regulatory upheaval is a certainty in both Europe and the US, the Swiss system’s use of referenda means that change, if it comes, will be slow. But it could be tricky to decamp completely from the UK in case the AIM directive puts heavy restrictions on non-EU funds. So it seems likely that firms will want to guard their EU regulatory optionality by keeping a London presence. Having dual offices thus gives a fund a regulatory toe-hold in each system.”
“Consultants and managers note that life style, too, is a key consideration. Firms that canvas their partners about moving abroad often find it difficult to convince wives and family to rip up their lifestyles and relationships. The Swiss Alps may be beautiful and have their fans, especially among partners with young families, but the cantons around Zurich can be tough socially for non-German speakers. And Zurich, whatever its charms, pales beside London as a cultural and entertainment centre.”
“Nor should it be forgotten that Switzerland is itself badly bruised from the credit crunch. Private bank customers in Geneva lost an estimated $7 billion in Madoff and many funds-of-funds in the city are still bleeding. The woes that have afflicted UBS have ensured that Zurich, too, has felt the pain. Moreover, capital is flowing out as tax amnesties in Italy and Germany encourage investors to bring money home.“
Talk of London-based hedge fund exodus to Switzerland is exaggerated. Indeed, the fall of sterling against the euro and the Swiss franc even gives the UK a competitive cost advantage.
SWF invest $1 trillion in global equity markets – less than expected
Sovereign wealth funds invest about $1 trillion in international equities which is less than half the $2.2 trillion (end 2008) managed by the 10 largest SWFs, according to a report by RiskMetrics commissioned by the Investor Responsibility Research Center Institute (IRRC).
The report said: “The current total size of the SWFs and the percentage invested in international equities is less than the figures generally reported in the media. Consequently estimates of their potential impact on the international capital markets are exaggerated.”
The study found that the total capital available to SWFs has decreased as the global financial crisis has dampened demand for some of the exports these countries rely on to bolster their funds. As a result, their global equity exposures have decreased, while their bond allocations have increased.
Why Active Share is important for IROs
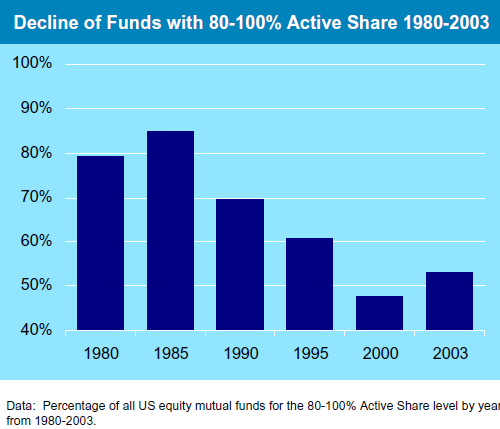
In 2006 two Yale academics (Cremers, M. and Petajisto) introduced the term Active Share as a measure of active portfolio management. The term measures the degree of overlap in holdings at the stock level between the fund manager and their benchmark index. An Active Share of 100% implies zero overlap with the benchmark while a pure index fund will have an Active Share of 0%.
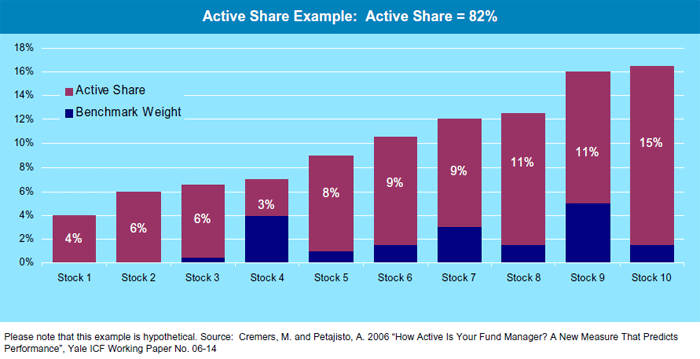
Unfortunately, as shown in the chart below, Active Share has been declining over time which means that many funds are increasingly mirroring their index. This is due to the increased use of passive investment techniques but also because of the widespread use of benchmarks by active managers. The rise of these “Closet Indexers” is an issue for IROs when considering which investors to target. This is especially important as many so-called “Active” fund managers may actually be “Closet Indexers” who will typically only overweight or underweight their positions very slightly.
Spending valuable management time with a “Closet Indexer” will have little impact on marginal additional purchases of stock. Therefore, it is clearly very important for IROs to be able to identify the stock pickers with concentrated portfolios in order to achieve the most from their meetings.
The great exodus from equities?
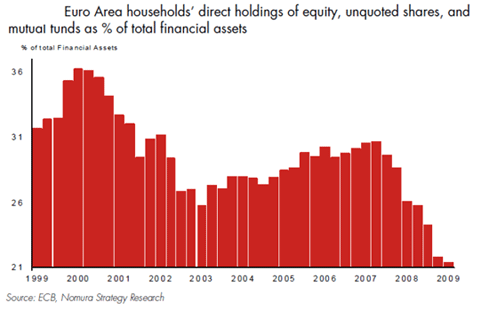
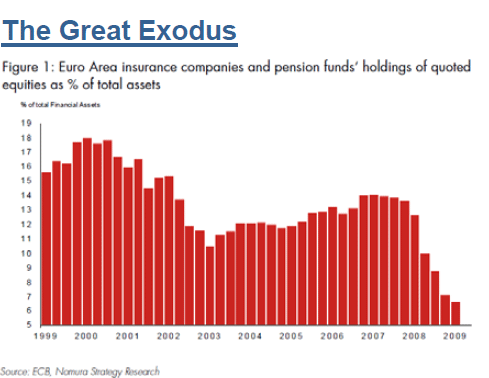
Thanks to our friends at 2CG for highlighting the collapse in the levels of investments of European insurance and pension funds in quoted equities. The bulls see this as confirmation of the wall of money sitting on the sidelines just waiting to get back into stocks. But the worry is that some investors, particularly some insurance companies will not be back to the equity markets for some time at least. The retail investor also appears to have capitulated. Targeting the right investors might just be getting more difficult.
