Author Archives: Phoenix Investor Relations

IMA offers corporate access guidance ahead of FSA deadline

Source, The Trade, Feb 13, 2013

UK buy-side trade body the Investment Management Association (IMA) has published a paper to guide institutional investors through corporate access rules in response to efforts from the regulator to separate out different broker services

The core issue in using dealing commissions to pay for corporate access is its classification as research, a point the Financial Services Authority (FSA) has sought to clarify through attestation letters. CEOs of UK asset managers must reply to the letter by 28 February stating that their firm abides by the current rules.

Buy-side firms looking to pay for corporate access through dealing commissions or commission sharing agreements (CSAs) risk infringing FSA rules if these services do not include direct broker research.

While the push for a clearer separation of broker services – execution, research and corporate access – is in line with wider efforts to make the financial ecosystem more transparent, smaller buy-side firms risk losing a key service provided by brokers to meet with corporate managers of firms they wish to invest in.

Guy Sears, director of institutional at the IMA, who helped author the paper, has called for wider debate on how corporate access is arranged and priced.

“Corporate access for buy-side firms overseas can reflect sheer commercial size – if you’re a large asset manager an issuing corporate firm will welcome a meeting, but for smaller buy-side firms they need brokers to provide access,” he commented. In the short-term, however, Sears said buy-side firms must ensure they meet the FSA rules.

The IMA paper sets out a number of scenarios whereby corporate access is not classed as research and as such cannot be paid for from dealing commissions.

“There are so many component activities that can fall under the heading of corporate access that buy- and sell-side firms need to unpack the details and look at exactly what is occurring and check it is classed as research according to the FSA rules,” Sears said.

In November, the FSA published a damning report on broker services, claiming only two out of 15 asset managers randomly assessed complied with current FSA rules on conflicts of interest.


Trans-Atlantic interest in broker research model on the rise

Source: myinvestorcircle.com 22 Jan, 2013

Michael Glenister

Interest in broker commission payments spreads to US as critics continue to voice concern about state of the research and corporate access industry

Interest in potential problems with the system for corporate access payments is growing in the Unites States, according to the author of a report on the subject. which triggered widespread interest from national media and the Financial Services Authority (FSA) in the UK last year.

“Interest in the issue of corporate access payments is beginning to surface on the other side of the Atlantic after the topic received significant interest here in 2012,” Vince Heaney told this publication.

Heaney authored Independent Research: because they’re worth it?, a report for the Centre for the Study of Financial Innovation issued last year. Work from the CSFI has recently attracted national interest and added to regulatory pressure on broker research and corporate access payments.

The FSA last year issued a report into conflicts of interest at asset management firms, commenting that numerous managers were failing to adequately control broker commissions paid for with client money.

Those commissions are often seen as payment for a bundle of services, including corporate access to the boards of investee companies.

That practice was criticised by the landmark Myners report released in the UK in 2001, which noted that the bundling allowed managers to pay for a variety of services with client money, without disclosing all the fees they were attracting.

Extel, a Reuters organisation, recently estimated that corporate access payments account for around 25% of commission fees, up from 15% in the last three to four years.

Some commentators have more recently commented on other potential flaws inherent in the existing model for broker research and corporate access.

One example of a criticism voiced to this publication is that the practice of investment bank analysts providing research to clients while also providing that information to proprietary trading desks is widespread.

“Analysts at large firms will release research to clients but are conflicted because they also provide the releases to their own desks, often doing so in advance to allow the bank to get an edge over clients,” commented one source who preferred not to be named.

A handful of large financial institutions were fined by the US SEC (Securities Exchange Commission) in 2012 for forging partnerships which allowed market data and analysis either to be seen by internal trading desks before clients, or offered to specific clients before others in order to give them a competitive advantage.

According to Heaney’s report, research providers at sell-side banks are likely to come under increasing pressure in future years as their revenues are restricted.

His report notes that declining trading volumes in the equities markets are making the business of providing research less appealing to sell-side banks.

Heaney added that change provided an opportunity for independent research providers (IRPs) provided they can demonstrably deliver value. “Sell-side contraction does not imply an easier ride for IRPs,” he said, adding to evidence in his report which indicates that asset managers are increasingly seeking to measure the added value gained from trade ideas which come from IRP advice.

The CSFI survey of asset managers found that almost half (47%) of asset management firms currently pay for independent research, while 87% expect the independent research sector to gain market share next year.

ISS 2011 Voting Results Report – Europe

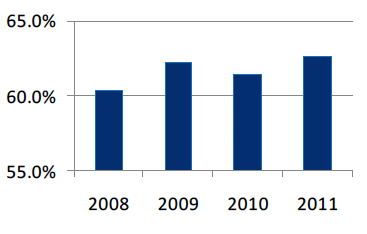
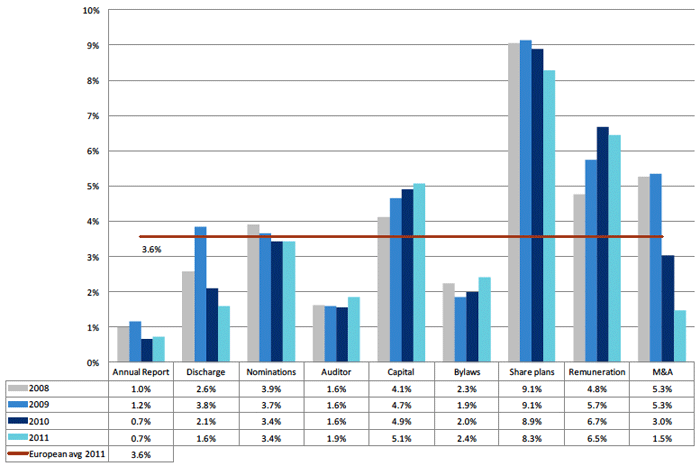
Europe wide shareholder participation has increased over the previous four years with 2011 exhibiting the highest level of turnout recorded.

The overall level of dissent has remained static over the past four years, despite turbulence within European markets.

Europe wide turnout has increased over the previous four years with 2011 exhibiting the highest turnout recorded. This is partly due to the implementation of the EU Shareholder Rights Directive and the removal of barriers to voting, as well as the increasing interest in best practice codes that seek to encourage and enhance the benefits of more active engagement through such participation.

European voter turnout at shareholder meetings 2008-2011:


Source: ISS

European dissent by theme:

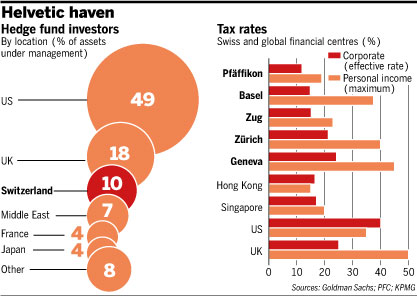
Hedge Fund Assets by Location

London is home to most of Europe’s $400bn hedge fund industry, followed by Switzerland which hosts an estimated $200bn pool of capital run by some 500 managers (includes satellite offices from London) according to London’s Financial Times. When combined together, Swiss private banks and fund managers are estimated to account for more than 20% of the global hedge fund industry’s assets.

FT hedge pie

Foreign holdings of U.S. long-term securities

fed
Figure 1, panel A, shows foreign holdings of U.S. securities by asset type for the years 2003 to 2011.Most foreign holdings of U.S. securities are in debt (almost 70 percent as of June 2011), especially in long-term debt. Treasury securities and corporate bonds are the two largest categories of debt that foreigners hold. The share of long-term Treasury securities in total foreign holdings of U.S. securities has increased from about 20 percent in 2007 to more than 30 percent in 2011, mainly due to investment of substantial foreign exchange accumulations by foreign official investors. Foreign official investors are the largest foreign investors in U.S. Treasury securities; their share in total foreign holdings of U.S. long-term Treasury securities has grown from 62 percent in June 2002 to 77 percent in June 2011. Short-term debt holdings (not shown) have been small, generally less than 10 percent of total foreign holdings since 2002.

Figure 1, panel B, reports the geographic distribution of foreign holdings of U.S. securities.
China and Japan are currently the two largest foreign holders of U.S. securities, but holdings by other Asian countries and Mideast countries have also grown rapidly in the past few years. Belgium, Luxembourg, Switzerland, and the United Kingdom collectively have large foreign holdings of U.S. securities; of this group, the United Kingdom is the largest
holder, and the third-largest holder of U.S. long-term securities overall. The large volume of holdings in this group of countries highlights the main pitfall in the liabilities survey— “custodial bias.” The country attribution of foreign holdings of U.S. securities as reported in the liabilities surveys is imperfect because many foreign owners entrust the safekeeping of their securities to institutions that are neither in the United States nor in the owner’s country of residence. For example, a German investor may buy a U.S. security and place it in the custody of a Swiss bank. In the surveys of foreign holdings of U.S. securities, such a holding typically is recorded against Switzerland rather than Germany. This custodial bias contributes to the large recorded foreign holdings of U.S. securities in major financial centers, such as Belgium, Luxembourg, Switzerland, the United Kingdom, and the Caribbean banking centers.

The large holdings of U.S. securities by entities in offshore financial centers—especially those in the Caribbean—pose additional obstacles to interpreting foreign investors’ cross-border financial activity because these holdings largely reflect the securities portfolios of the numerous investment funds that have been established in such offshore locations rather than the portfolio preferences of residents of those countries.Moreover, because many financial institutions have affiliated banking and nonbanking offices in these offshore locations, analyzing securities transactions through these centers can be difficult without knowing whether offsetting transactions are occurring through other parts of the financial accounts. For example, when entities located in financial centers buy U.S. securities from U.S. broker–dealers, those transactions are recorded as financial inflows to the United States. However, such transactions could well be offset by equally sizable net outflows to the same financial centers but reported in other parts of the financial accounts, such as the TIC banking data.

Foreign official and private investors have very different portfolios of U.S. long-term securities, as seen in panels C and D of figure 1. Foreign official holdings of U.S. securities are dominated by Treasury securities and U.S. agency securities, which together account for about 85 percent of such holdings. In contrast, foreign private investors’ holdings of U.S. long-term securities are dominated by equity and corporate bonds, each of which account for about 40 percent of such holdings.

Source: Federal Reserve Bulletin – May 2012

European Institutional Asset Management Survey

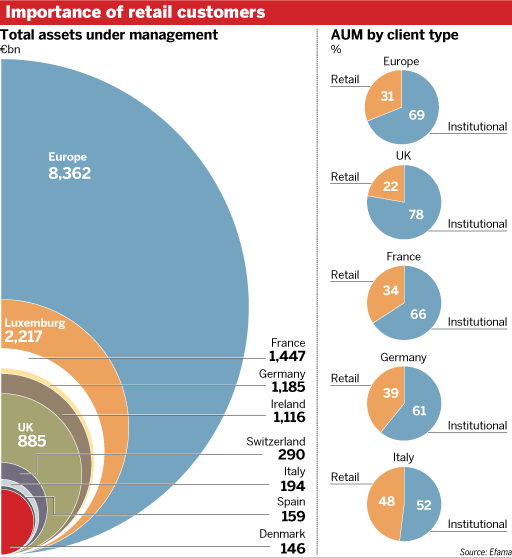
The 11th European Institutional Asset Management Survey (EIAMS), researched by Invesco, found that investors have increased their allocations to fixed income while reducing their equity exposure.  The 2011 survey received responses from 148 investors in 25 countries (mainly Benelux, UK, Ireland, France and the Nordics), with total assets under management of EUR 1,194 billion, or an average of EUR 8.1 billion.

For investor relations officers at public companies we believe the most interesting points are:

1 – European institutions invest most of their equity portfolios internationally while the bulk of their fixed income assets remain in their domestic markets.

2.- The flight to safety has continued with fixed income gaining more ground with investors, but last year’s freefall in equities appears to have been halted with just a small decline, and the sharp reduction in cash suggests that investors are less risk averse.

3. – Fixed income accounts for 58% of institutional portfolios’ assets, compared with 51% in the prior year.

4. – Fixed income looks to gain further ground with corporate bonds the big likely winner at the expense of government debt.  Indeed, 22% of investors are aiming to increase their fixed income component with 30% of investors increasing their exposure to corporate bonds and 31% reducing their government bond holdings.

5. – Allocations to equities have fallen slightly to 27%, down from 2009’s level of 29%, and well below the 32% average allocation reported in 2007.  UK & Ireland remain true to their traditionally high equities weightings, with shares creeping back up to 45% of portfolios this time after slipping to 44% in 2009, though they are still below the 55% weighting seen in 2007.

6. – A small net increase in equity investment is forecast and this is most likely to occur outside of domestic markets. 19% of respondents planned to boost their equity allocations against 15% who signaled an intention to sell.  More marked, though, is the likely swing away from domestic shares towards those in other European countries, the USA, Asia and other markets.  Only 11% of respondents planned to increase equities from their home market, while 21% intended to up the proportion of other European equities as well as those from Asia, while 20% planned to lift USA equity allocations and 23% aimed to boost their “other markets” stock holdings. Institutions are clearly turning away from home markets in equity and fixed income investment. Average domestic equity allocation has fallen to 18% of the total equity slice from 23.5%.

Click on the charts below for a full display.

1


2


3

The top managers of pension fund assets in the UK

The management of most pension fund assets in the UK is often delegated to diversified investment management houses and very few self-managed pension funds still exist.

The key players are:

Rank Pension AUM $m
1. Legal & General 370,014
2. BlackRock 252,814
3. Insight 144,183
4. State Street Global Advisors 57,231
5. Standard Life 56,109
6. Schroder Inv. Mgt. 44,649
7. M&G Investments 42,585
8. Threadneedle 41,080
9. Hermes 40,127
10. UBS Global Asset Mgt. 19,802
11. Baillie Gifford 14,478
12. Aberdeen Asset Mgt. 8,665
13. Newton Inv. Mgt. 7,889
14. Capital International 7,713

Source: Hymans Robertson

It’s interesting to note that significant segments of these assets are managed passively (according to Hymans Robertson at least 40%).

The remaining self-managed funds worth targeting for investor relations outreach activity include; Aerion, BAE Systems, BP Investment, British Airways Pension, British Steel Pension and Universities Superannuation Scheme.

Dividends are back

Aggregate dividents per share for S & P 500 companies

Aggregate dividents per share for S & P 500 companies

S&P 500 dividends per share, which hit a recent low in 2010, are forecast to grow at an annual rate of 9.8% over the next three years, driven by strong earnings and large cash reserves.


S & P 500 dividend actions - 12 months ended February

S & P 500 dividend actions - 12 months ended February

Year-over-year dividend increases are up 57.1%, while decreases and omissions are down 81.7% and 74.8%, respectively.