Author Archives: Phoenix Investor Relations
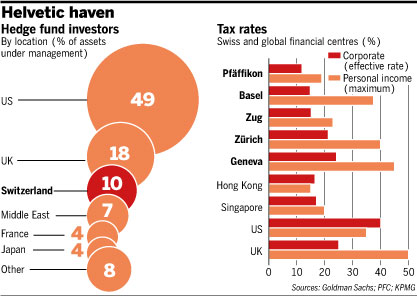
Hedge Fund Assets by Location
London is home to most of Europe’s $400bn hedge fund industry, followed by Switzerland which hosts an estimated $200bn pool of capital run by some 500 managers (includes satellite offices from London) according to London’s Financial Times. When combined together, Swiss private banks and fund managers are estimated to account for more than 20% of the global hedge fund industry’s assets.
Foreign holdings of U.S. long-term securities

Figure 1, panel A, shows foreign holdings of U.S. securities by asset type for the years 2003 to 2011.Most foreign holdings of U.S. securities are in debt (almost 70 percent as of June 2011), especially in long-term debt. Treasury securities and corporate bonds are the two largest categories of debt that foreigners hold. The share of long-term Treasury securities in total foreign holdings of U.S. securities has increased from about 20 percent in 2007 to more than 30 percent in 2011, mainly due to investment of substantial foreign exchange accumulations by foreign official investors. Foreign official investors are the largest foreign investors in U.S. Treasury securities; their share in total foreign holdings of U.S. long-term Treasury securities has grown from 62 percent in June 2002 to 77 percent in June 2011. Short-term debt holdings (not shown) have been small, generally less than 10 percent of total foreign holdings since 2002.
Figure 1, panel B, reports the geographic distribution of foreign holdings of U.S. securities.
China and Japan are currently the two largest foreign holders of U.S. securities, but holdings by other Asian countries and Mideast countries have also grown rapidly in the past few years. Belgium, Luxembourg, Switzerland, and the United Kingdom collectively have large foreign holdings of U.S. securities; of this group, the United Kingdom is the largest
holder, and the third-largest holder of U.S. long-term securities overall. The large volume of holdings in this group of countries highlights the main pitfall in the liabilities survey— “custodial bias.” The country attribution of foreign holdings of U.S. securities as reported in the liabilities surveys is imperfect because many foreign owners entrust the safekeeping of their securities to institutions that are neither in the United States nor in the owner’s country of residence. For example, a German investor may buy a U.S. security and place it in the custody of a Swiss bank. In the surveys of foreign holdings of U.S. securities, such a holding typically is recorded against Switzerland rather than Germany. This custodial bias contributes to the large recorded foreign holdings of U.S. securities in major financial centers, such as Belgium, Luxembourg, Switzerland, the United Kingdom, and the Caribbean banking centers.
The large holdings of U.S. securities by entities in offshore financial centers—especially those in the Caribbean—pose additional obstacles to interpreting foreign investors’ cross-border financial activity because these holdings largely reflect the securities portfolios of the numerous investment funds that have been established in such offshore locations rather than the portfolio preferences of residents of those countries.Moreover, because many financial institutions have affiliated banking and nonbanking offices in these offshore locations, analyzing securities transactions through these centers can be difficult without knowing whether offsetting transactions are occurring through other parts of the financial accounts. For example, when entities located in financial centers buy U.S. securities from U.S. broker–dealers, those transactions are recorded as financial inflows to the United States. However, such transactions could well be offset by equally sizable net outflows to the same financial centers but reported in other parts of the financial accounts, such as the TIC banking data.
Foreign official and private investors have very different portfolios of U.S. long-term securities, as seen in panels C and D of figure 1. Foreign official holdings of U.S. securities are dominated by Treasury securities and U.S. agency securities, which together account for about 85 percent of such holdings. In contrast, foreign private investors’ holdings of U.S. long-term securities are dominated by equity and corporate bonds, each of which account for about 40 percent of such holdings.
Source: Federal Reserve Bulletin – May 2012
European Institutional Asset Management Survey
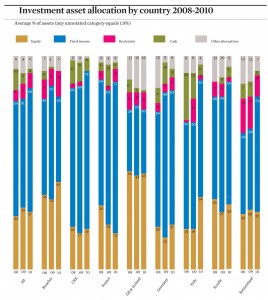
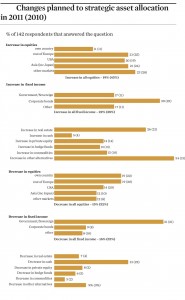
The 11th European Institutional Asset Management Survey (EIAMS), researched by Invesco, found that investors have increased their allocations to fixed income while reducing their equity exposure. The 2011 survey received responses from 148 investors in 25 countries (mainly Benelux, UK, Ireland, France and the Nordics), with total assets under management of EUR 1,194 billion, or an average of EUR 8.1 billion.
For investor relations officers at public companies we believe the most interesting points are:
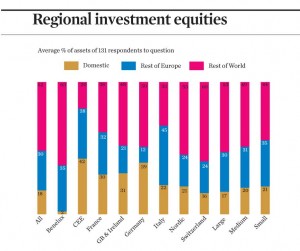
1 – European institutions invest most of their equity portfolios internationally while the bulk of their fixed income assets remain in their domestic markets.
2.- The flight to safety has continued with fixed income gaining more ground with investors, but last year’s freefall in equities appears to have been halted with just a small decline, and the sharp reduction in cash suggests that investors are less risk averse.
3. – Fixed income accounts for 58% of institutional portfolios’ assets, compared with 51% in the prior year.
4. – Fixed income looks to gain further ground with corporate bonds the big likely winner at the expense of government debt. Indeed, 22% of investors are aiming to increase their fixed income component with 30% of investors increasing their exposure to corporate bonds and 31% reducing their government bond holdings.
5. – Allocations to equities have fallen slightly to 27%, down from 2009’s level of 29%, and well below the 32% average allocation reported in 2007. UK & Ireland remain true to their traditionally high equities weightings, with shares creeping back up to 45% of portfolios this time after slipping to 44% in 2009, though they are still below the 55% weighting seen in 2007.
6. – A small net increase in equity investment is forecast and this is most likely to occur outside of domestic markets. 19% of respondents planned to boost their equity allocations against 15% who signaled an intention to sell. More marked, though, is the likely swing away from domestic shares towards those in other European countries, the USA, Asia and other markets. Only 11% of respondents planned to increase equities from their home market, while 21% intended to up the proportion of other European equities as well as those from Asia, while 20% planned to lift USA equity allocations and 23% aimed to boost their “other markets” stock holdings. Institutions are clearly turning away from home markets in equity and fixed income investment. Average domestic equity allocation has fallen to 18% of the total equity slice from 23.5%.
Click on the charts below for a full display.
The top managers of pension fund assets in the UK
The management of most pension fund assets in the UK is often delegated to diversified investment management houses and very few self-managed pension funds still exist.
The key players are:
| Rank | Pension AUM $m | |
| 1. | Legal & General | 370,014 |
| 2. | BlackRock | 252,814 |
| 3. | Insight | 144,183 |
| 4. | State Street Global Advisors | 57,231 |
| 5. | Standard Life | 56,109 |
| 6. | Schroder Inv. Mgt. | 44,649 |
| 7. | M&G Investments | 42,585 |
| 8. | Threadneedle | 41,080 |
| 9. | Hermes | 40,127 |
| 10. | UBS Global Asset Mgt. | 19,802 |
| 11. | Baillie Gifford | 14,478 |
| 12. | Aberdeen Asset Mgt. | 8,665 |
| 13. | Newton Inv. Mgt. | 7,889 |
| 14. | Capital International | 7,713 |
Source: Hymans Robertson
It’s interesting to note that significant segments of these assets are managed passively (according to Hymans Robertson at least 40%).
The remaining self-managed funds worth targeting for investor relations outreach activity include; Aerion, BAE Systems, BP Investment, British Airways Pension, British Steel Pension and Universities Superannuation Scheme.
Dividends are back

Aggregate dividents per share for S & P 500 companies
S&P 500 dividends per share, which hit a recent low in 2010, are forecast to grow at an annual rate of 9.8% over the next three years, driven by strong earnings and large cash reserves.
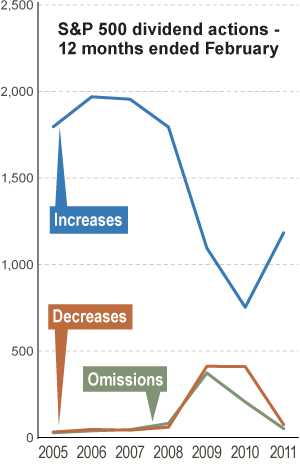
S & P 500 dividend actions - 12 months ended February
Year-over-year dividend increases are up 57.1%, while decreases and omissions are down 81.7% and 74.8%, respectively.
Peter Kaye – Dalton Strategic Partnership (DSP)
We see evidence for a continuation of the bull market in the US which can be found by looking at the strength in the US economy and US companies. While the headlines on poor housing data and a slowly recovering labour market seem to get the most air time, lead indicators for the US economy are telling a very different story. US companies are in great shape, for several quarters earnings estimates have surpassed expectations by a wide margin. We are now approaching the first quarter earnings season and the most recent releases from Accenture and Oracle imply the surprise trend is still intact and in addition, US corporate balance sheets are pristine. In addition to monetary expansion we have witnessed a rotation by investors out of other assets into equities which will provide fuel for the next stage of the bull market. A key driver for this will be valuation differences between assets. While there are clearly negatives such as the oil price, the level of the US dollar and the \\\’QE2 exit\\\’, we believe there remains much upside to the current US market
we maintain our bullish outlook on the North American equity sector and this seems to be backed up by strong flows into the sector, not only from US investors but also now here in the UK.
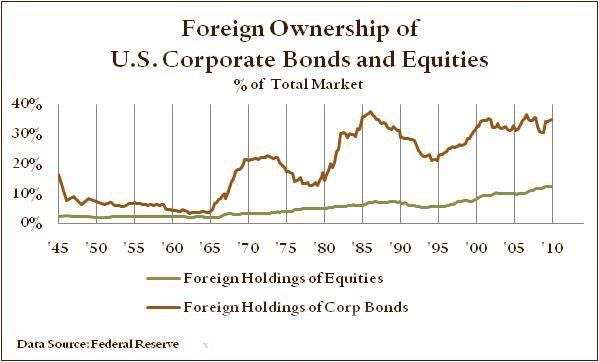
Foreign ownership of U.S. Corporate Bonds and Equities
Swiss Asset Management
Switzerland is global market leader in crossborder private banking
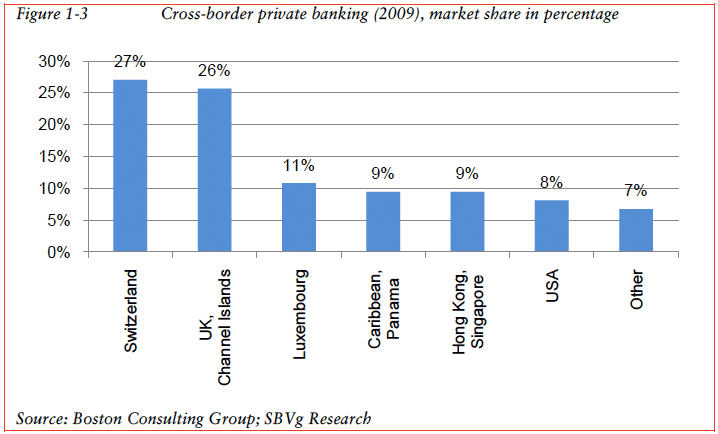
Assets managed in Switzerland
CHF 5,600 billion managed in Switzerland
In total, banks in Switzerland managed assets of around CHF 5,600 billion at end-2009, up 3.7% or CHF 200 billion from the previous year. Assets managed include the following items: securities, fiduciary deposits, savings and investment liabilities to clients and term deposits.
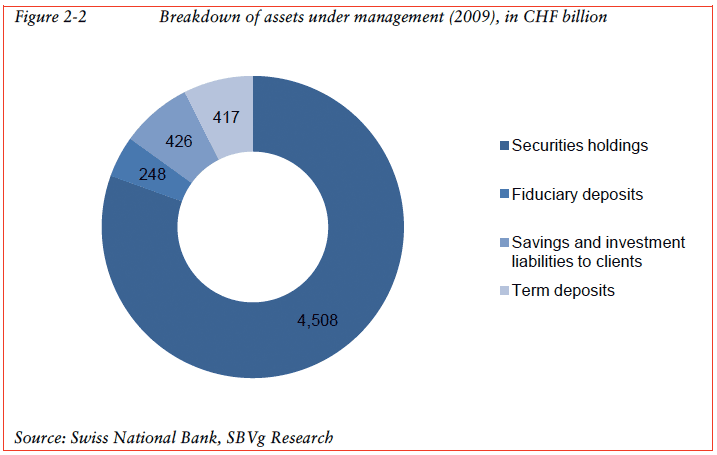
At end-2009, securities holdings at market value came to CHF 4,508 billion; of these, roughly 62% came from institutional investors, 29% from private clients and just under 10% from companies. Custody accounts for foreign clients comprised 55%, for domestic clients 45%. Between September 2009 and October 2010, securities holdings of foreign private investors fell by around CHF 68.9 billion or 9.6%. This was mainly due to currency effects, i.e. the appreciation of the Swiss franc, rather than outflows of client money.
Source: Wealth Management in Switzerland – SBA – February 2011
Global assets
Significant increase in global assets
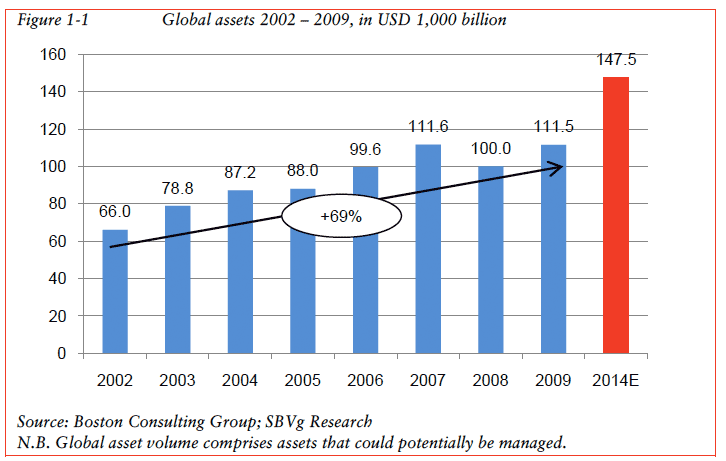
Global assets at the end of 2009 were USD 111,500 billion (BCG 2010a), roughly the same as the previous high seen in 2007 (see figure 1-1). This represents growth of USD 11,500 billion or 11.5% over the year, mainly driven by the recovery in financial markets. It is estimated that in 2014 global assets will reach USD 147.5 billion.

Source: Wealth Management in Switzerland – SBA – February 2011

